Shelved, September 2026. This page is kept as a record of what I built and learnt.
Where It Started
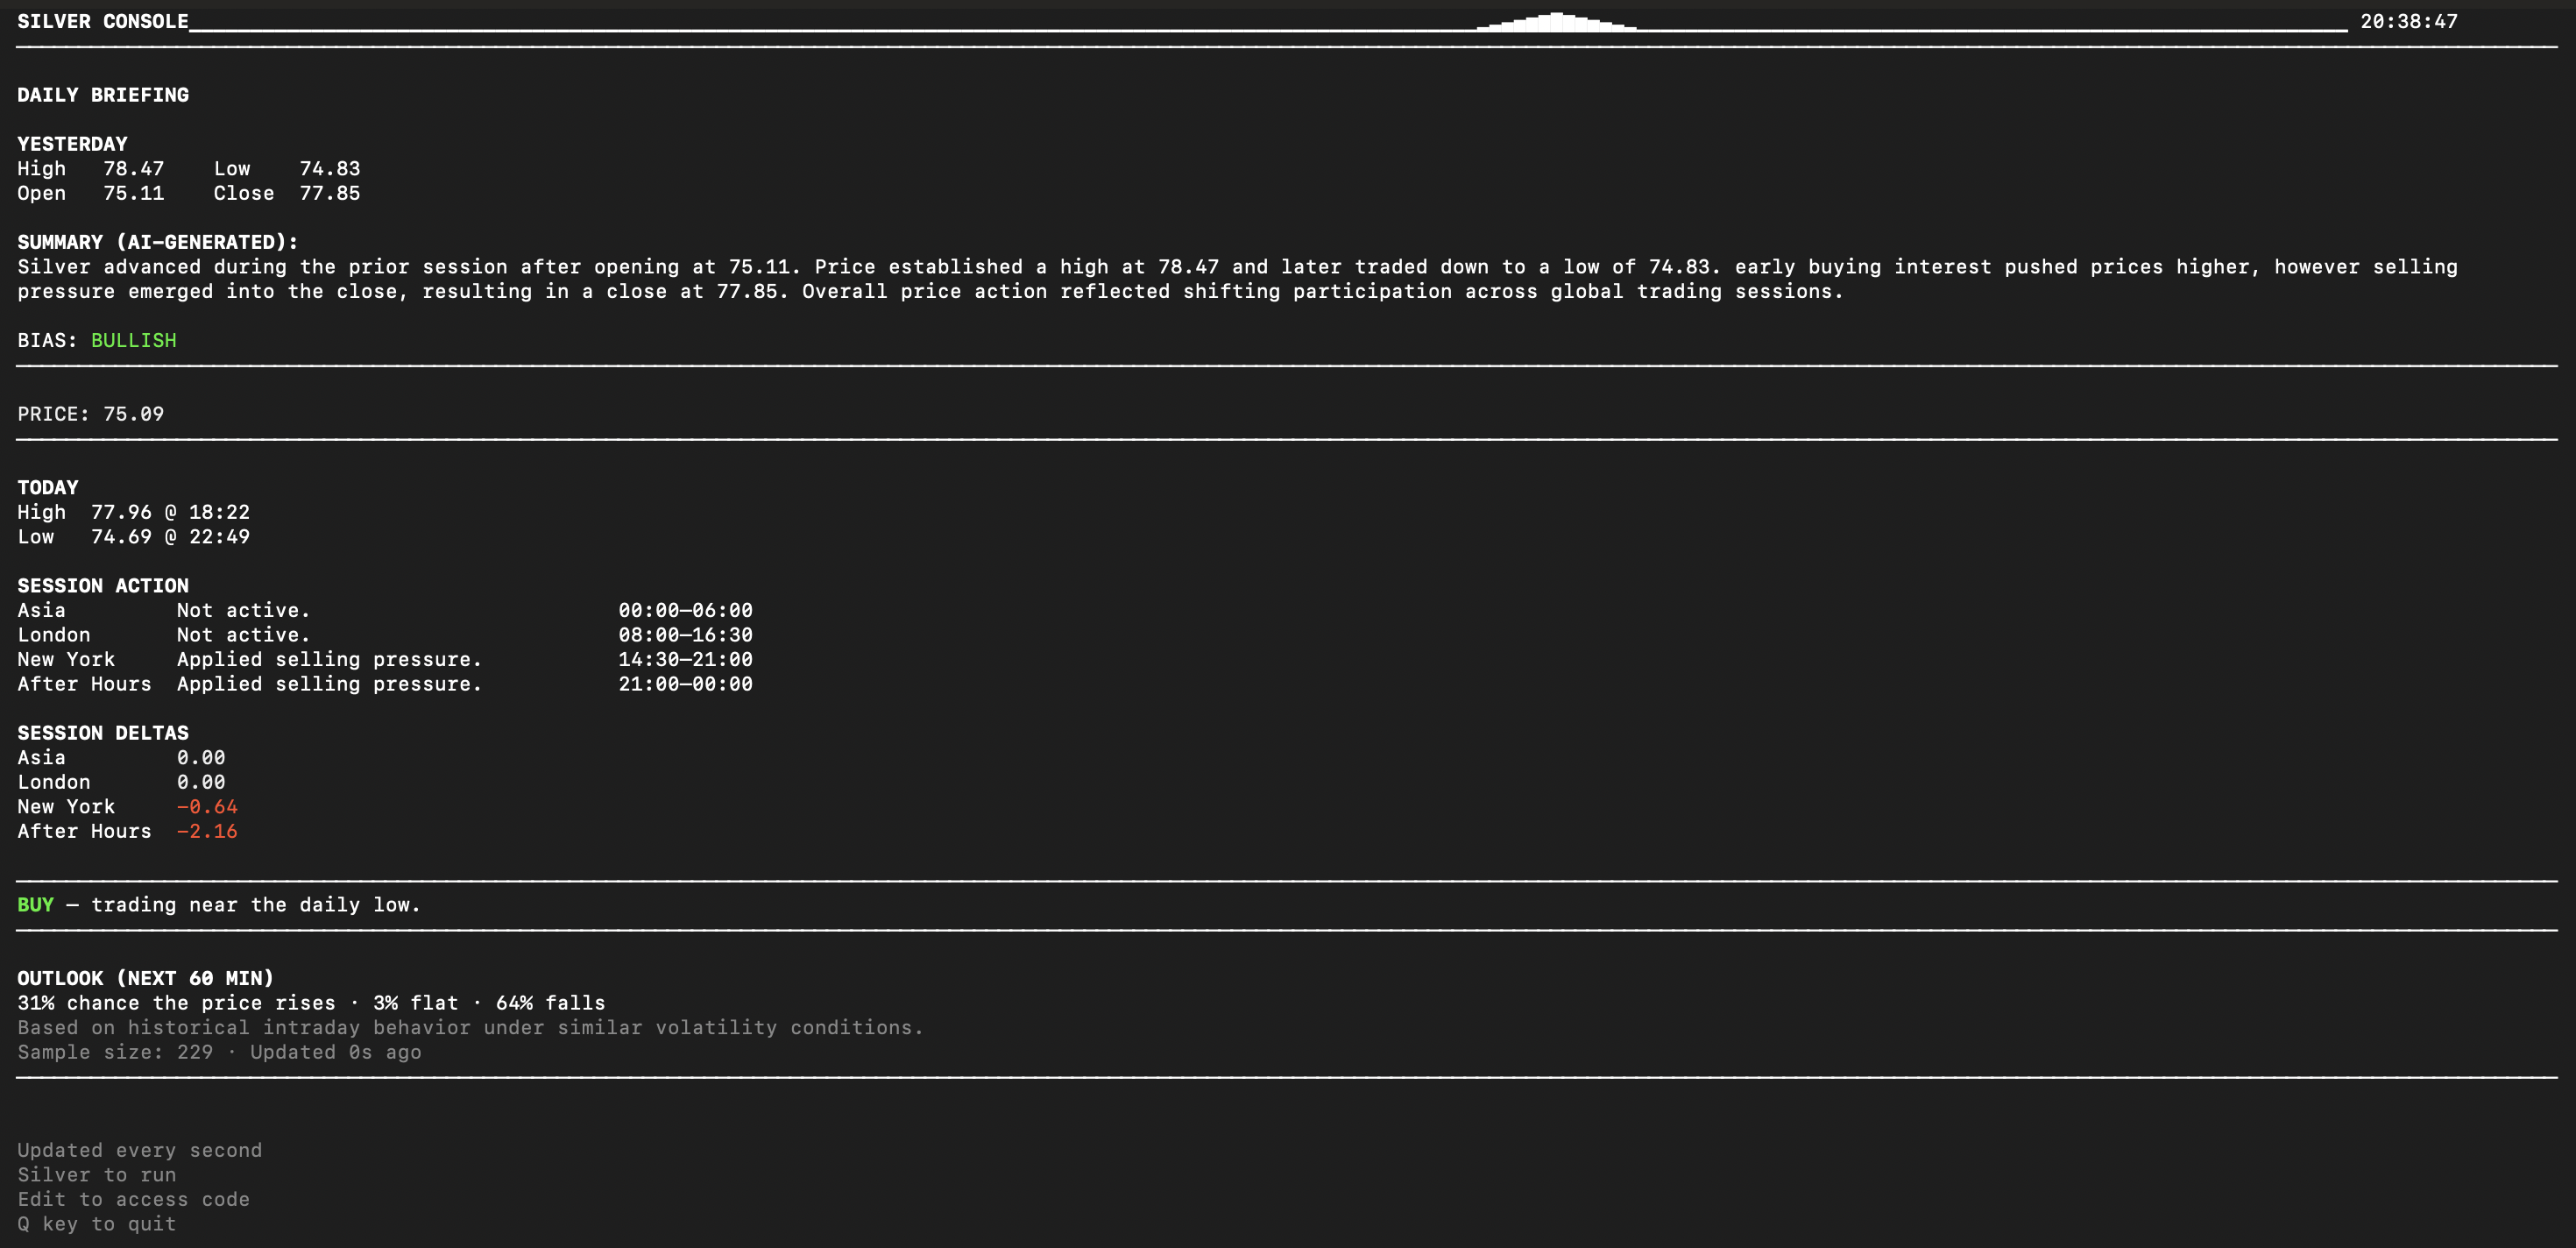
Taciturn started whilst I was starting out trading, the idea came in the vision of a terminal that could give me financial insights on what the market of my choice was doing, whether it was near the daily high or daily low, and after coding a trend manager i could receive financial call outs via this terminal, telling me to buy or sell there was alot of other infomation which id look at usually whilst trading such as session deltas, yesterdays highs and lows, data id usually look at manually this was about 700 lines of code no broker integration no execution
The next version was to put this on a gui which would scan for patterns using candlesticks, then would give me an outlook based on strong buy, buy, sell or strong sell, given the bias an hourly breifing would occur telling me what ive missed, this was during the time i was busy with work and would often miss market movmements due to other commitments.
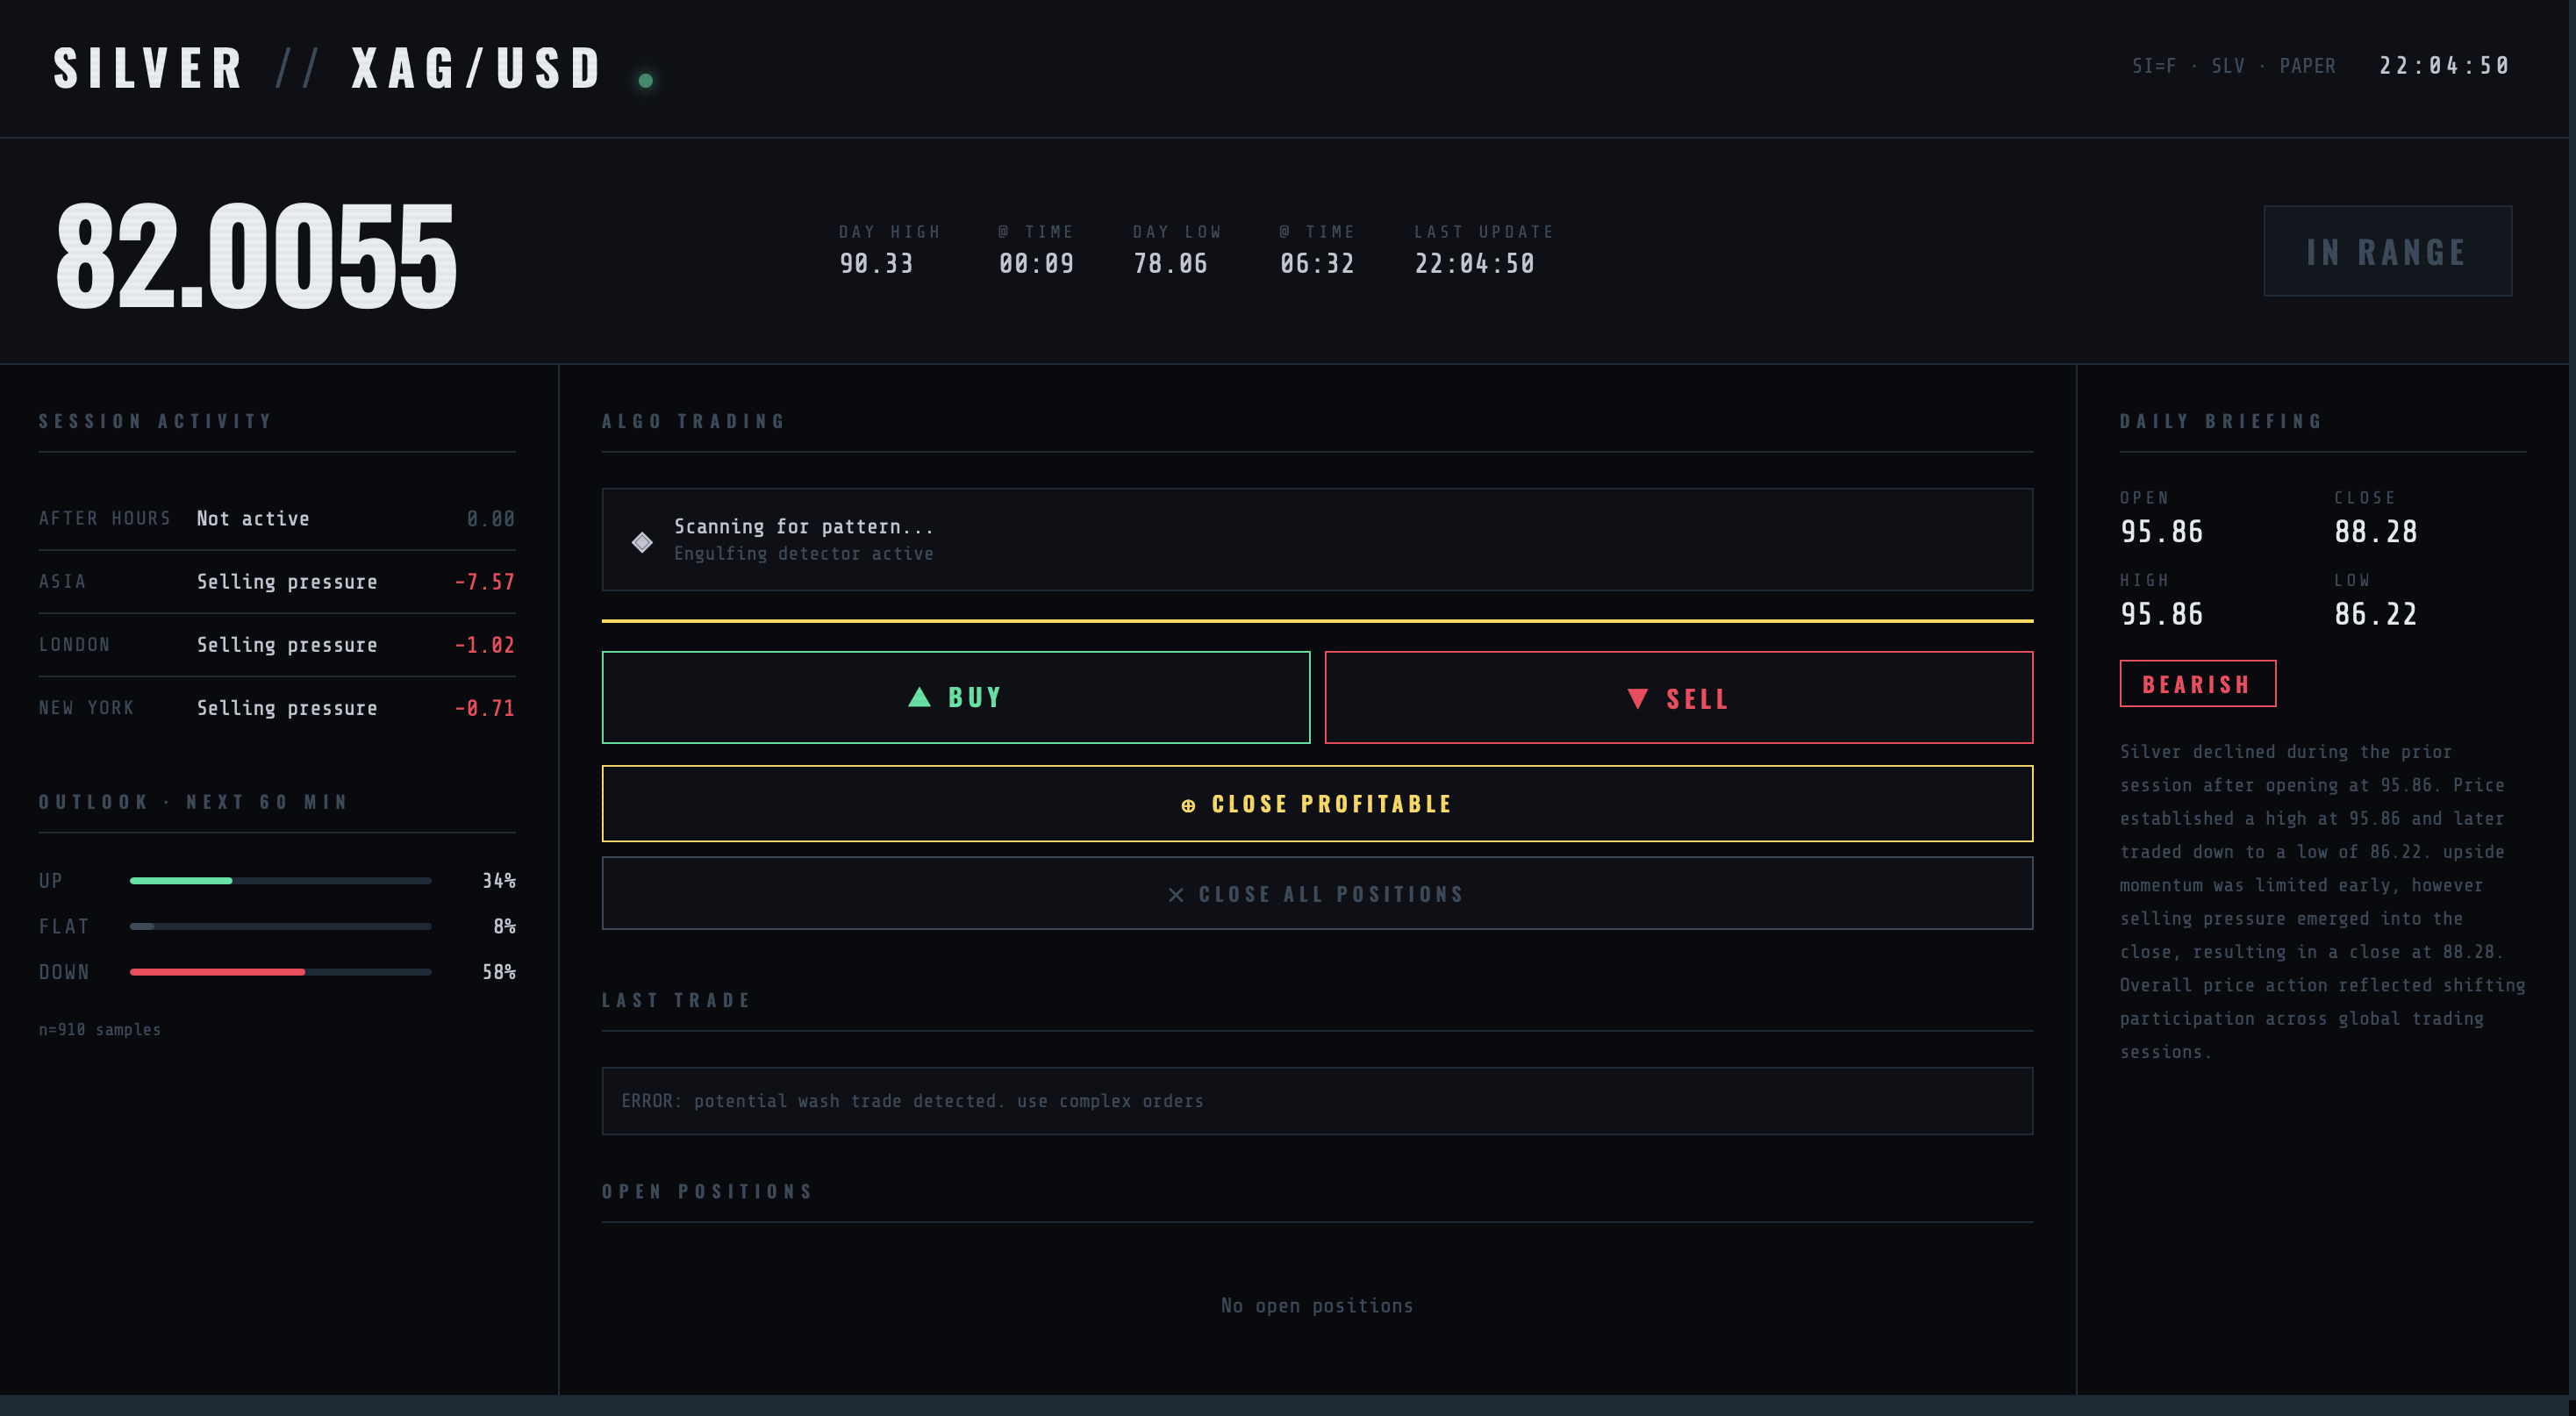
Taciturn which was previously called ‘SPS’ for silver processing system, was getting really good at predicting market movements, I would start acting accordingly to what the system has prompted, which lead to many sucessful trades so much so I wanted to automate it, however this was a much bigger task than I thought it would be after having no prior coding knowledge.
How It Evolved
The project grew in phases. Each one introduced a new broker, a new strategy, or a new layer of infrastructure:
v1–3 (Alpaca, paper trading) — ETF trading on GLD and SLV using candlestick pattern recognition on daily bars. Win rates looked promising on backtests — 60–80% on some patterns. Then I moved to intraday bars and they collapsed to 14–45%. Patterns that work on daily data often don’t survive the noise of shorter timeframes. That was a costly discovery.
v4 (OANDA, spot forex) — Migrated entirely to OANDA for XAU/USD and XAG/USD spot forex. Rebuilt the signal stack around indicator-based approaches: volume-weighted momentum crossovers, MACD histogram signals, pure indicator models. Added a trend filter that checks the hourly EMA slope before every trade — if the trend is flat or against you, it blocks entry.
v5 (final) — Multiple signals running in parallel, risk management with broker-level stop losses on every order, a full web dashboard, and Pushover notifications. The system ran continuously, managed its own cooldowns, and halted itself if daily losses exceeded a threshold.
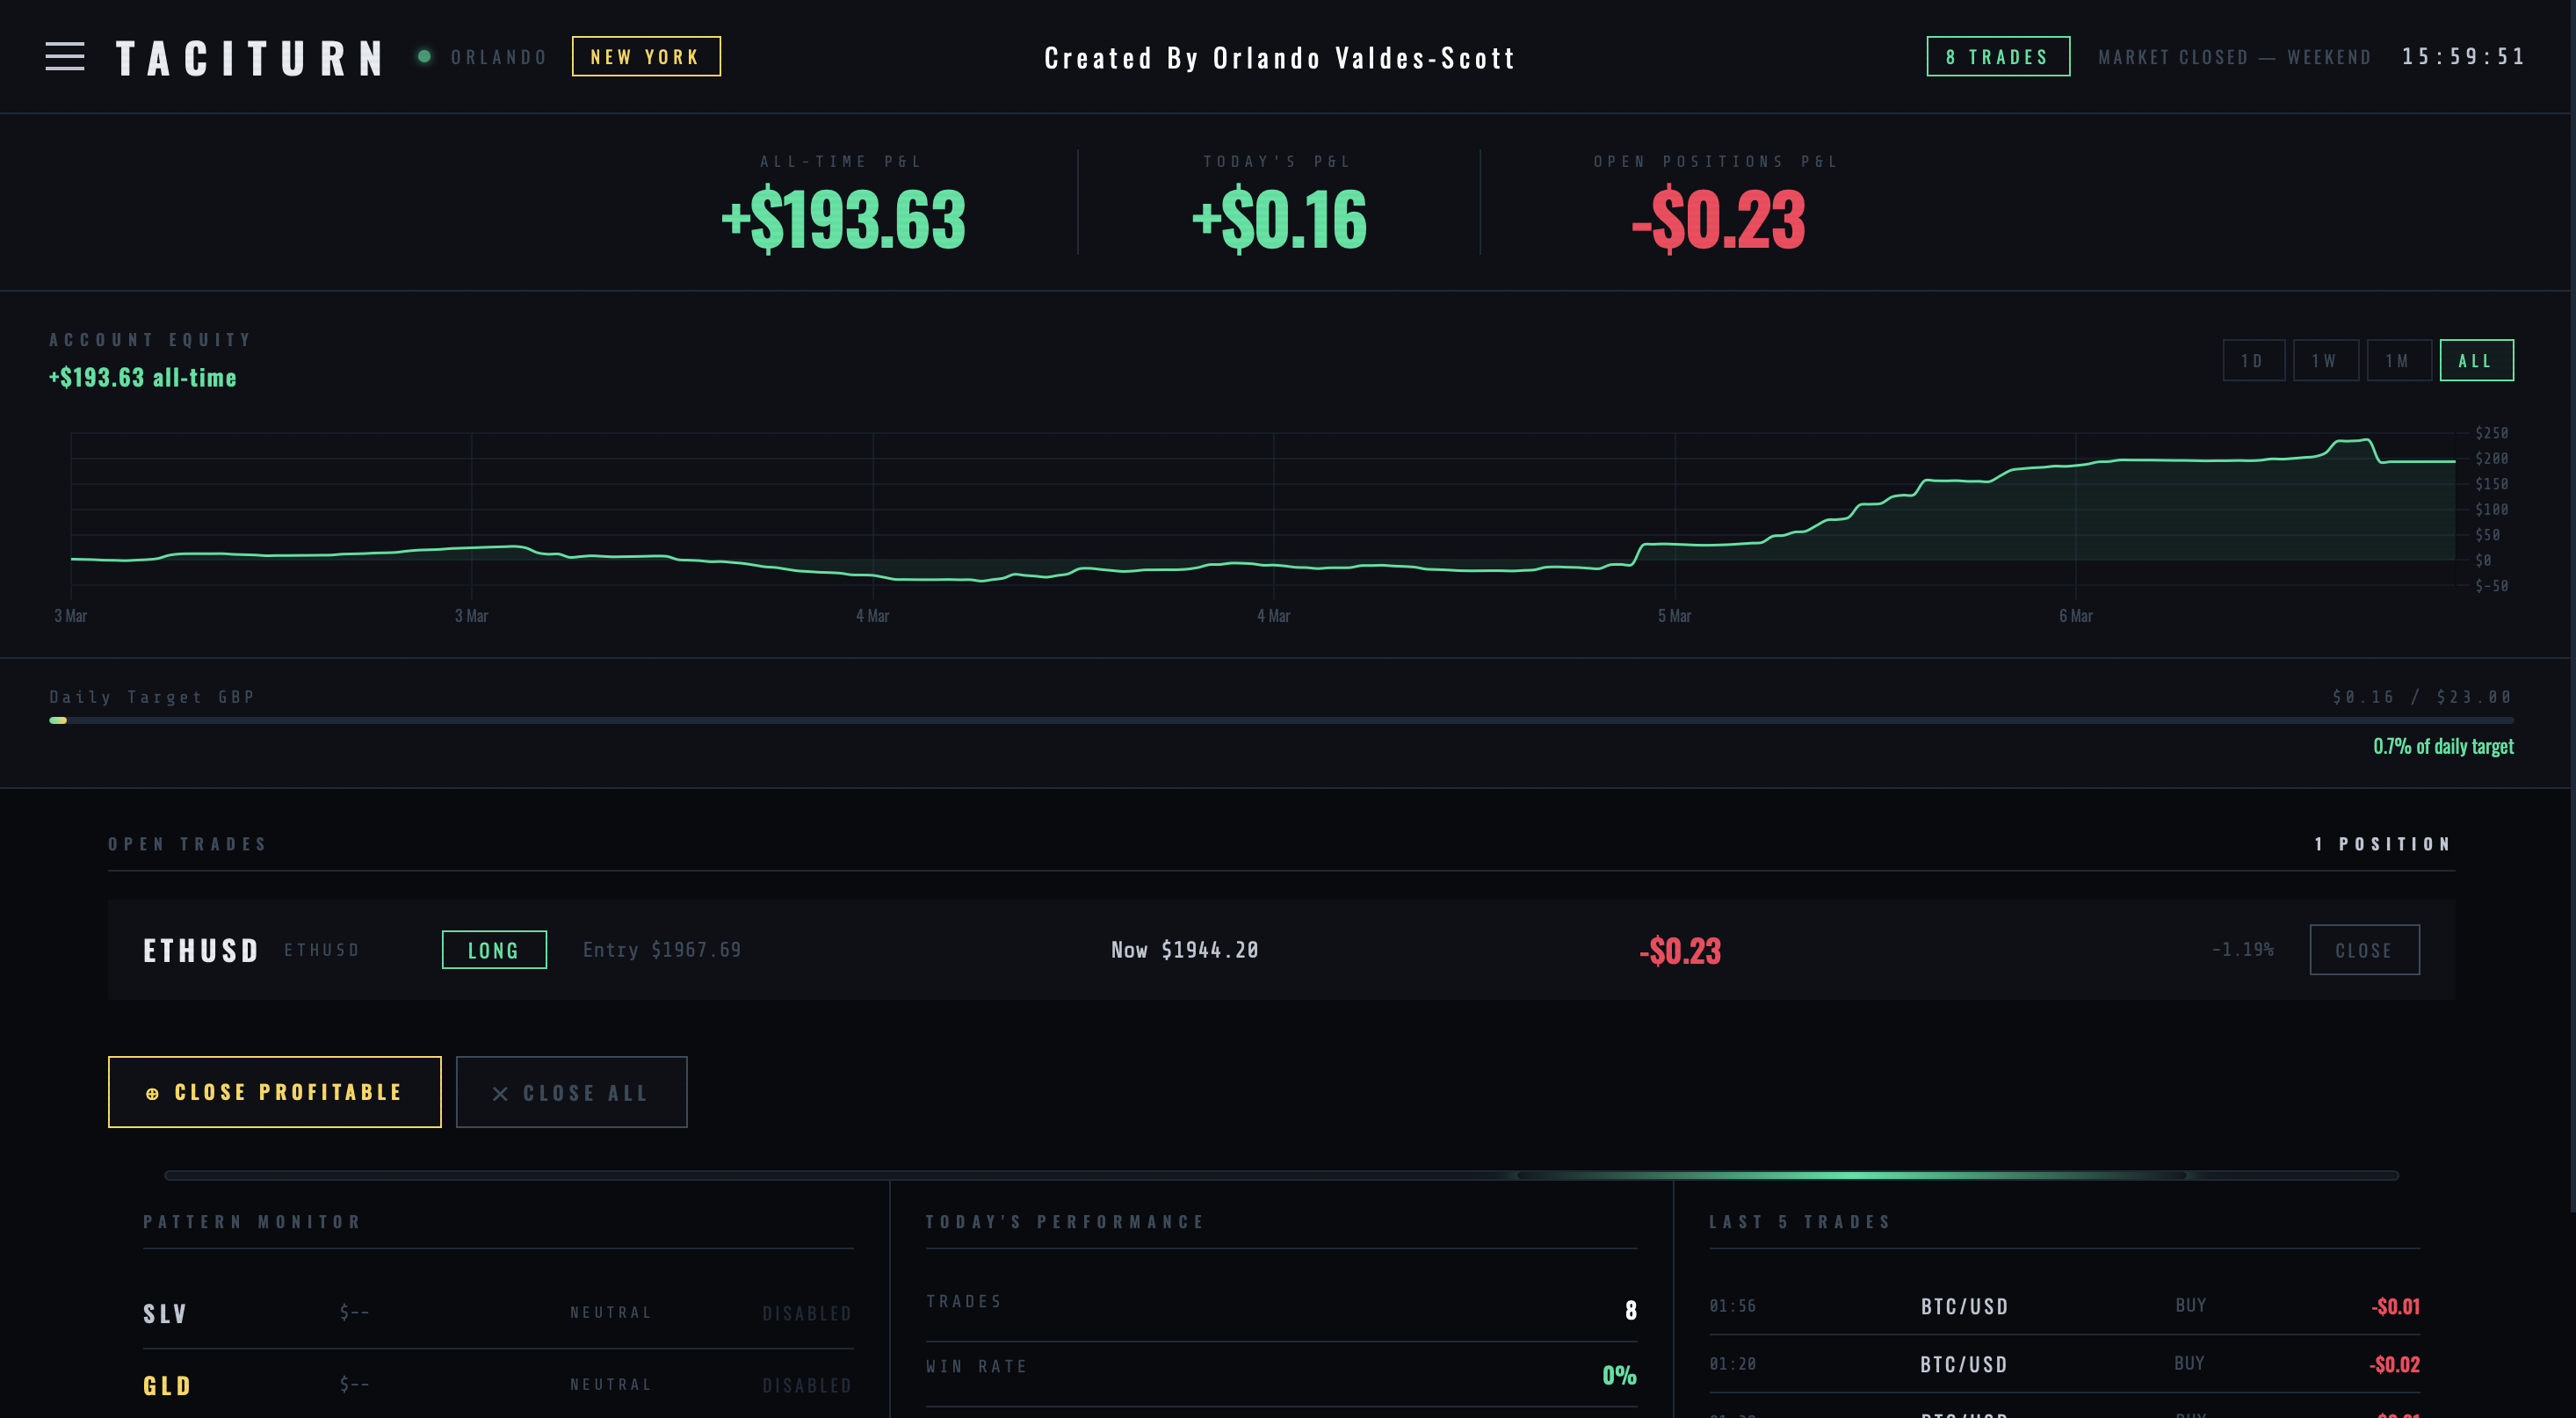 The most up to date gui, in the early days of development
What I’d Do Differently
A lot. In rough order of importance:
- Demo mode for three months before any real capital. I jumped into live-adjacent testing too early. Bugs that seem minor in development become expensive in production.
- Build the backtest engine first. Every signal I’ve added has had to be validated retrospectively. A proper backtest framework would have saved weeks.
- Pick one broker and stay there. Migrating mid-project is expensive in time and introduces subtle bugs — currency conversion errors, API differences, state management issues.
- Only trade gold. Gold is liquid, well-documented, and moves in ways that technical signals can capture. Silver is noisier. Crypto is a different category entirely.
- Forecast bugs before they’re expensive. Duplicate trades from race conditions. Stop losses set at the wrong scale. Currency conversions applied twice. All of these happened and all of them were avoidable with more careful design upfront.
Where It Is Now
Taciturn is shelved. It ran 24/7 on a DigitalOcean VPS in London, trading a demo account, and formed my Extended Project Qualification. I stopped it in September 2026 to put the time into Alladin.
The final focus was risk: every trade carried a fixed take-profit and a tight hard stop, so each change to the signal stack could be judged on clean, comparable results. The last active signals used volume-weighted momentum crossovers gated through an H1 EMA trend filter, alongside MACD histogram signals and a small set of candlestick patterns.
The infrastructure includes a real-time web dashboard, a geopolitical news terminal, a Neural Link RAG memory system and an automated agent layer (daily reports, log monitoring and a strategy guard) — all exposed via Cloudflare Tunnel at taciturn.uk.
Abbadon — the Machine-Learning Gate
Abbadon is a LightGBM model that sits between Taciturn’s signals and the broker. Every signal is scored before an order is placed, and low-confidence setups are blocked.
It ran in shadow mode first — logging which trades it would have blocked while Taciturn traded normally — so its judgement could be checked against real outcomes before it was trusted with any decisions. It went live in September 2026.
The principle is the same as the rest of the project: nothing controls trades until the evidence says it should.